NIFTY Possible Top for Coming Months.
Nifty Monthly and Other Index Monthly Chart RSI Based View Share Here For Knowledge Base.
NIFTY500 Monthly Stocks Above 50-200 MA Percentages in This Chart,
We see above 50MA is around 91% stocks and More Then 97% stocks above 200MA.
As per chart when ever above 50MA stocks above 90+% then we see some correction in This Indices Stocks. Above 200MA Stocks is Hit 1st time at 97+%, As per my observation is Not good Sign For Bull Market.

NIFTY50 Monthly RSI Chart.
We see When ever RSI near 80 we face some correction in Market.
2004-2006-2008-2014-2018-2021.

NIFTY50 Quarterly Chart.
We see when ever Quarterly RSI 75 to 80 we see some Healthy time wise correction around 1 Quarter.
So possible that in coming months we may see some sideways to down side move in some Stocks.

Nifty100 Monthly Chart.
We see that when ever RSI near 80 we face some Correction in this index stocks.

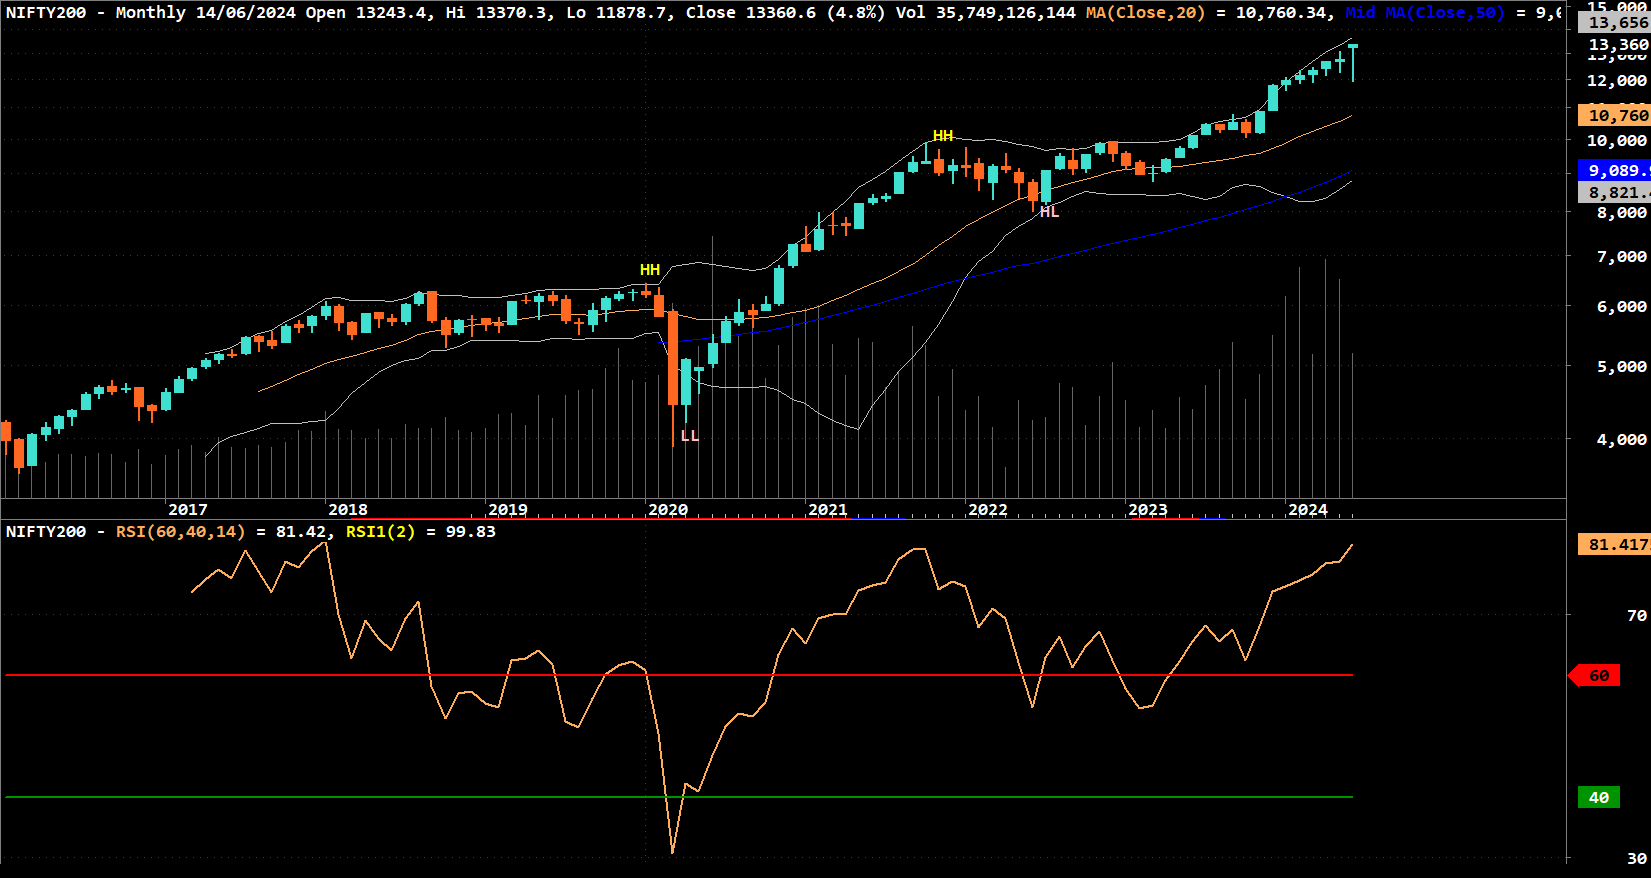
Nifty200 Monthly Chart.
We see 2018-2021 when RSI near 80 we see some correction in this index stocks.
May follow this pattern in Coming Months also.
NIFTY500 Monthly Chart.
We see 2008-2014-2018-2021 when ever RSI near 80 we see some Correction in this Index Stocks.
We see 2008-2014-2018-2021 when ever RSI near 80 we see some Correction in this Index Stocks.
May pattern Repeat This time Also.

NIFTYAUTO Monthly Chart
We see Monthly RSI Near 90 and we see that any index or stocks Monthly RSI near 90 or above that some correction in that counter. So Possible that history repeat it Self.

NIFTYBANK Monthly Chart
We see that from 2019 its face resistance near 70 level in RSI. Currently Trade near 67-68. so if fail again then we may see some correction in this stocks chart also.

NIFTYCOMMODITIES Monthly Chart
We see its RSI near 81-82, In 2021 we see near same level face resistance and correction in this index stocks.
We see its RSI near 81-82, In 2021 we see near same level face resistance and correction in this index stocks.

NIFTYCPSE Monthly Chart
We see that Monthly RSI at 94. Is call Highly Over Bought Zone. If Hold this Index Chart please follow Strict Stop loss.

Nifty Energy Monthly Chart
We see when ever Monthly RSI Near 80, 2018-2022 we see some correction in this Index Stocks.
This time may also follow same Pattern.

NIFTYFMCG Monthly Chart.
As per this chart we see last year when RSI near 80, we see some correction in this index Stocks.
Currently is Trade Near 74 RSI, so some chance that it may again Hit 80 level in coming months.

NIFTY Healthcare Monthly Chart.
We see in 1st Month of 2024 RSI near 80 and we face 2 month sideways correction in this index stocks.
Again RSI near 78 we may see some correction this this counter also.

NIFTY India Consumption Monthly Chart.
We see RSI near 86. we may see some correction in this index stocks also.

NIFTYINDIADEFENCE Monthly Chart.
We see continue 8 months made a Positive Candle and RSI at near 97.
alert in this index stocks also is important.

NIFTYINFRASTRUCTUTR Monthly Chart
We see in 2014-18 when ever RSI near 70 we see some correction. in 2021-above 70 and this time Near 87, We may see some correction in this index stocks also in coming Months.

NIFTYLARGECAP250 Monthly Chart
We see Monthly RSI at 85+, we may see some correction in Coming Months as same as 2021-22.

NIFTYMEDIA Monthly Chart.
We see is RSI trade in a Range of 40-60 and currently turn form 40 may Hit 60 or + in coming Months.
Buy if Sentiment is is not good then chance is less that cross 60+.

NIFTYIT Monthly Chart
We see in 2021 RSI hit Near 90 we see correction almost 8-10 months. and again RSI start up side Move. if sustain above 60 we may see some upmovein this counter in coming months.

NIFTYMETAL Monthly Chart.
We see when ever RSI Hit 70+ level in 2014-2017/18-2021 /22 , Currently at 78+, so some correction in coming Months Possible. History may repeat this time also.

NIFTYMIDSMALLCAP400 Monthly Chart.
We see in 2017/18-2021 when ever Monthly RSI at 83 we see some Health correction in this index Stocks. If History Repeat We may see same pattern repeat again in coming Months.

NIFTYMNC Monthly Chart.
We see In July 2021 when RSI near 82-85 then we see some 6-8 months correction in this index stocks. Currently RSI at near 89. if History Repeat we may see some correction in this counter Stocks also.

NIFTYNEXT50 Monthly chart.
We see that in 2017-2021 when ever RSI above 80 we see some monthly corrections. this time RSI at above 85, if History Repeat we may see some Monthly Corrections.

NIFTYPHARMA Monthly Chart.
We see when ever is sustain above 60 some side ways correction or consolidations in this counter.
Currently RSI at 78+ level.
If History Repeat then we may see some consolidation in this counter stocks.

NIFTYPRIVATEBANK Monthly Chart.
We see after 2020 correction its face resistance near 70 level, and last 1-2 yrs its try to hold 60+ level, if continue then we may see some rise in this index stocks near RSI 70 level and then we may see some correction in this counter also.

NIFTYPSE Monthly Chart.
We see Monthly RSI near 93-94 levels . we may see some consolidation or correction in this counter stocks also as per RSI Behaviour.

NIFTYPSUBANK Monthly Chart.
We see RSI near 80 and last 2 months is consolidations near High. this may continue in coming months also.

NIFTYREALTY Monthly Chart.
We see Currently RSI at 89+. is clearly over bought Zone as per RSI Indicator Reading. in 2018-20212 face resistance near 70 level of RSI. So alert for this index and its stocks also.

NIFTYSMALLCAP250 Monthly Chart.
We see in 2018-2021-2022 when evr RSI near 80 we see some correction in this counter stocks. currently RSI at near 81. if History Repeat then we may see some correction in this index and its Stocks.

Here we not recommends any BUY OR SELL.
Before trade consult your financial Advisor.
WE ARE NOT SEBI REGISTER ADVISOR OR FINANCIAL CONSULTANT.
For any query
https://t.me/Ratiocharts
Have A Great Time Ahead.
Take Care.
No comments:
Post a Comment