WELCOME 2023
Some Stocks On Ratio Analysis For The Month of January - 2023.
ABCAPITAL
Looks Good On Weekly Ratio Analysis With NIFTY. Break Triangle Breakout and near to break Swing High On Ratio. Then 1st time made higher top higher Bottom Formation on weekly.

===================================================
BANKBARODA
On monthly Ratio Analysis with NIFTY. We see that from 2015 Down Slope Trend line break,After 2014-15 1st time seen continue upside Move on ratio. It may Continue up side with some small correction. PSUBANK sector index also strong Out perform with NIFTY on Monthly and Weekly basis..

==================================================
CANBK
As per Monthly Ratio Chart With NIFTY. We see that break falling Trend line and continue upside Journey with Strong Up Move On Ratio.

CENTRALBK
As Per Monthly Ratio Chart We see that break falling trend line from 2019 and start up side move. if it may continue then we see some good up move in Price or less fall in price compare to Nifty.

=================================================
IOB
As Per Monthly Ratio Chart We see that break falling trend line from
2016 and start up side move. if it may continue then we see some good up
move in Price or less fall in price compare to Nifty.

===================================================
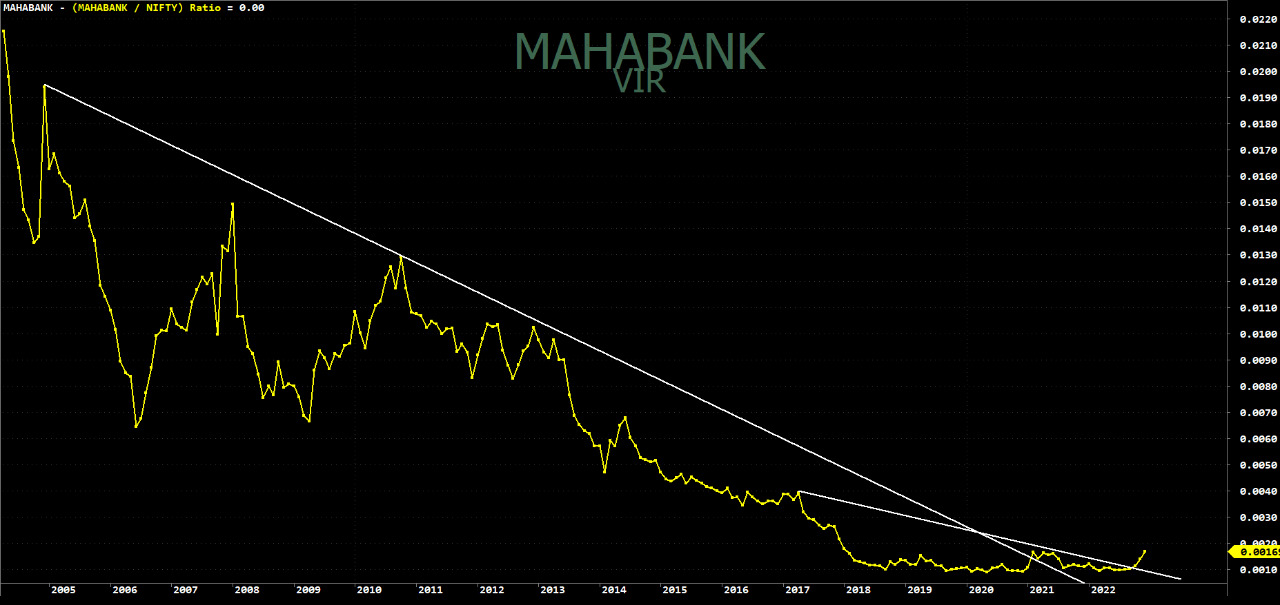
MAHABANK
As Per Monthly Ratio Chart We see that break falling trend line from
2005 and from 2017 start up side move. if it may continue then we see some good up
move in Price or less fall in price compare to Nifty.
====================================================
SBIN
As per chart we see that falling Trend Line from 2012 is break in 2021 and now is cross 2017-19 swing High and see Strong UP Move continue.

As per all above PSU BANK Stocks chart we see that is continue up move.
=======================================================
GODFRYPHLP
As per Monthly Chart we see that close near 2020 swing Ratio Top. and if success to cross that swing High and 50% of swing then we see good up move in this Stock in coming weeks-Months.

JINDALSTEL
As per ratio Chart we see that break falling trend line from 2014 and Break previous swing Top also.
we see strong Up move or fast recover in fall with market in coming Weeks and Months.

====================================================
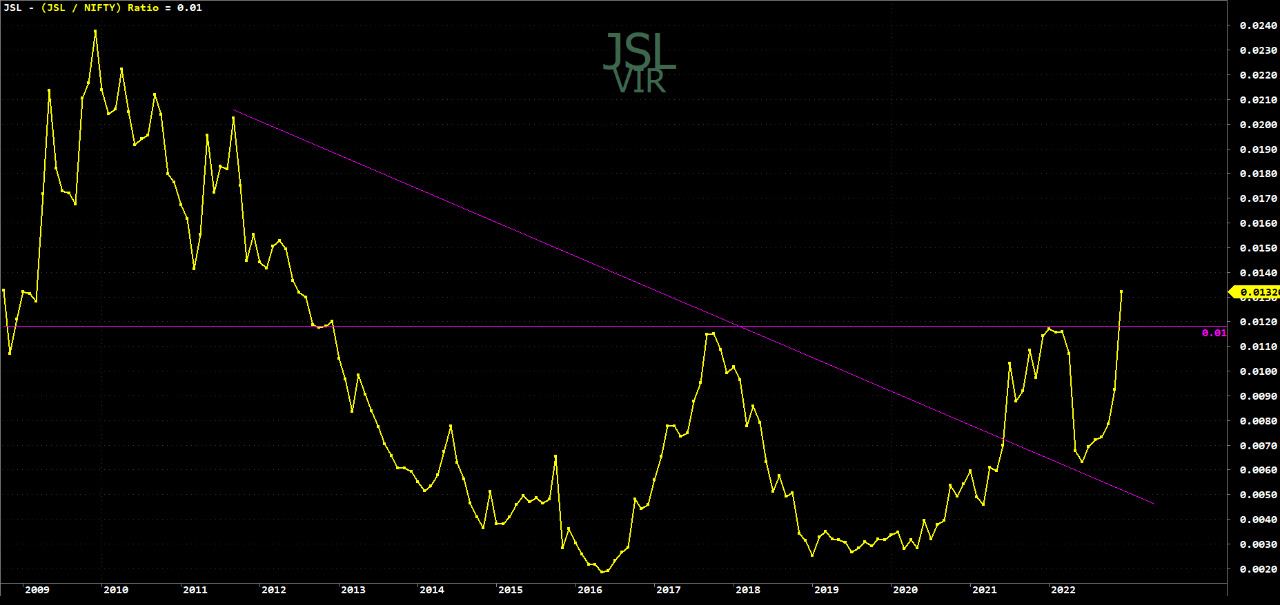
JSL
As per Ratio chart with NIFTY we see that test falling Trend line from 2012 and again start up move and cross 2017-2021 swing top and close above that. the is look strong up move in coming weeks and Months.
==================================================
JKLAKSHMI
As per Ratio Chart we see that break falling trend line from 2017 swing top , with that we see cross 2021 and 2018 swing top also and see sharp up move. As per chart we see that is always show sharp up and down move. if Hold this Trend line then we see more upside or New Swing High in ratio Also in coming Weeks and Months.

===================================================
KARURVYSYA
As per ratio Chart with Nifty we see that "W" Formation active on Monthly Ratio Chart. As per chart we see that 2004 to 2008 swing Bottom zone also.We see good up move or fast recovery in this stock if fall with market.

====================================================
LT
As per This ratio Chart we see that break falling Trend line from 2019 swing top and now approaching falling Trend line from 2014 and above that we see falling trend line from 2009. As per move we expect that it cross all falling trend line in coming wees and Months. and try to made a new swing high On ratio chart.

----------------------------------------------------------------------------------------
PSUBANKBEES
As per 1st monthly chart we see break falling Trend line from 2010 and see sharp up move in lase Months.

As per Weekly Ratio Chart we see that break Top to Top trend line and close above that. so coming Weeks and Months we see some up move with small corrections.

===================================================
Some Ratio Charts For Self Study and share your comments.
MAHINDCIE
Monthly Ratio Chart with Nifty.

==================================================
PHOENIXLTD
Monthly ratio chart With Nifty.

====================================================
PNBHOUSING
Weekly Ratio Chart with Nifty.

====================================================
RAYMOND
As per Monthly ratio Chart with NIFTY.

==================================================
RCF
As per monthly Ratio Chart with NIFTY.

======================================================
*SEBI SOCIAL MEDIA MANDATE & MANDATORY DISCLAIMER AS REQUIRED BY SEBI*
*KIND ATTENTION OF ALL MEMBERS*
Disclaimer from Admins as per SEBI norms:
Equity
Investments are subject to 100% market risks. Kindly refer to your
financial consultant advice before Trading & Investing in stock
markets.
This
group/channel is only for Educational and Learning, Knowledge Purposes.
Admins have no responsibility for your intended decision &
financial losses. Keep calculated & always analyzed your cash
position and risk bearing capacity before following msg of our group
postings.
Stock
market investments are VERY RISKY and being part of this group, you
agree that you understand the Market risks involved. Profits and Losses
are part of Share market. Most of the times, retail traders end up
making only Losses in Share market.
Kindly understand and act wisely. All member pls follow guidelines as applicable even in past too.
*SEBI SOCIAL MEDIA MANDATE & MANDATORY DISCLAIMER AS REQUIRED BY SEBI*
*KIND ATTENTION OF ALL MEMBERS*
*Disclaimer/ disclosure*
👉This group/channel does not provide any tips/recommendations/advice
👉All updates/analysis/posts/discussions are only for educational and learning purpose.
👉Do Consult your financial advisor before taking trades or investment decisions
👉Group/Channel Admins or Members are not responsible for any financial losses
👉Disclaimer/disclosure/terms and conditions applicable to all members of this group/channel
We are not SEBI registered. Members posting may not be SEBI registered also.
All the posts are for education and learning purpose only.


