Sunday, November 26, 2023

Some Daily Weekly RATIO chart Based on The EOD Date 24-11-2023

 As per Weekly Ratio chart with NIFTY500 stocks with same index based on momentum.

We Find some Good Stocks For Education Purpose Only.

We see that Nifty500 index strong breakout on Weekly chart, so we try to find some good and strong stocks from this index again this NIFTY500 index.

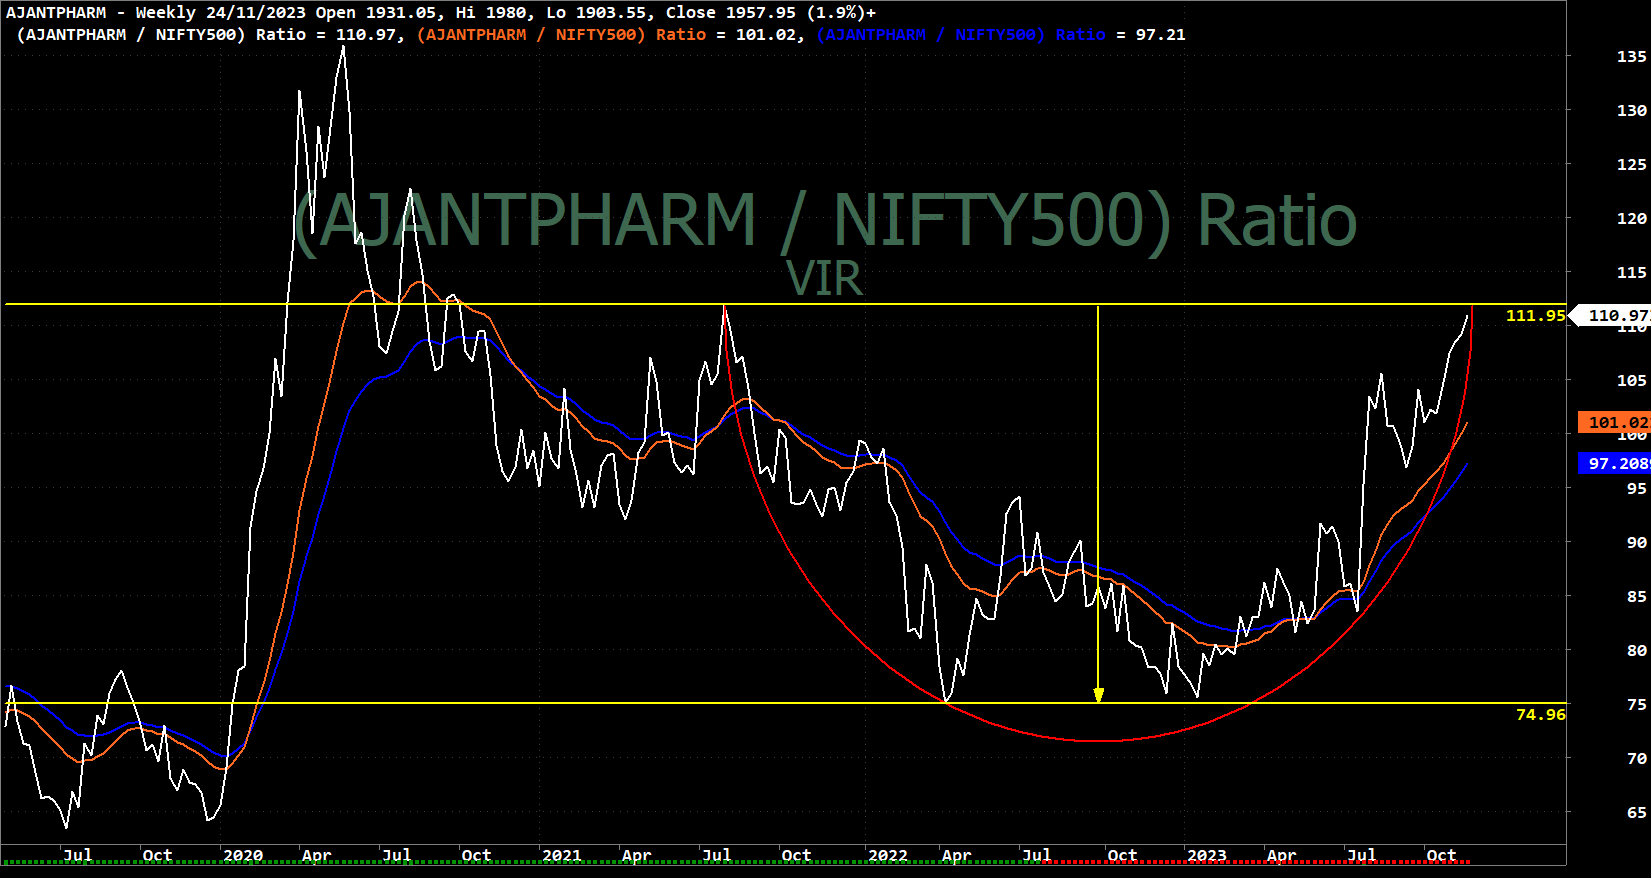
AJANTPHARMA / NIFTY500

ALKEM / NIFTY500

ASHOKLEY / NIFTY500

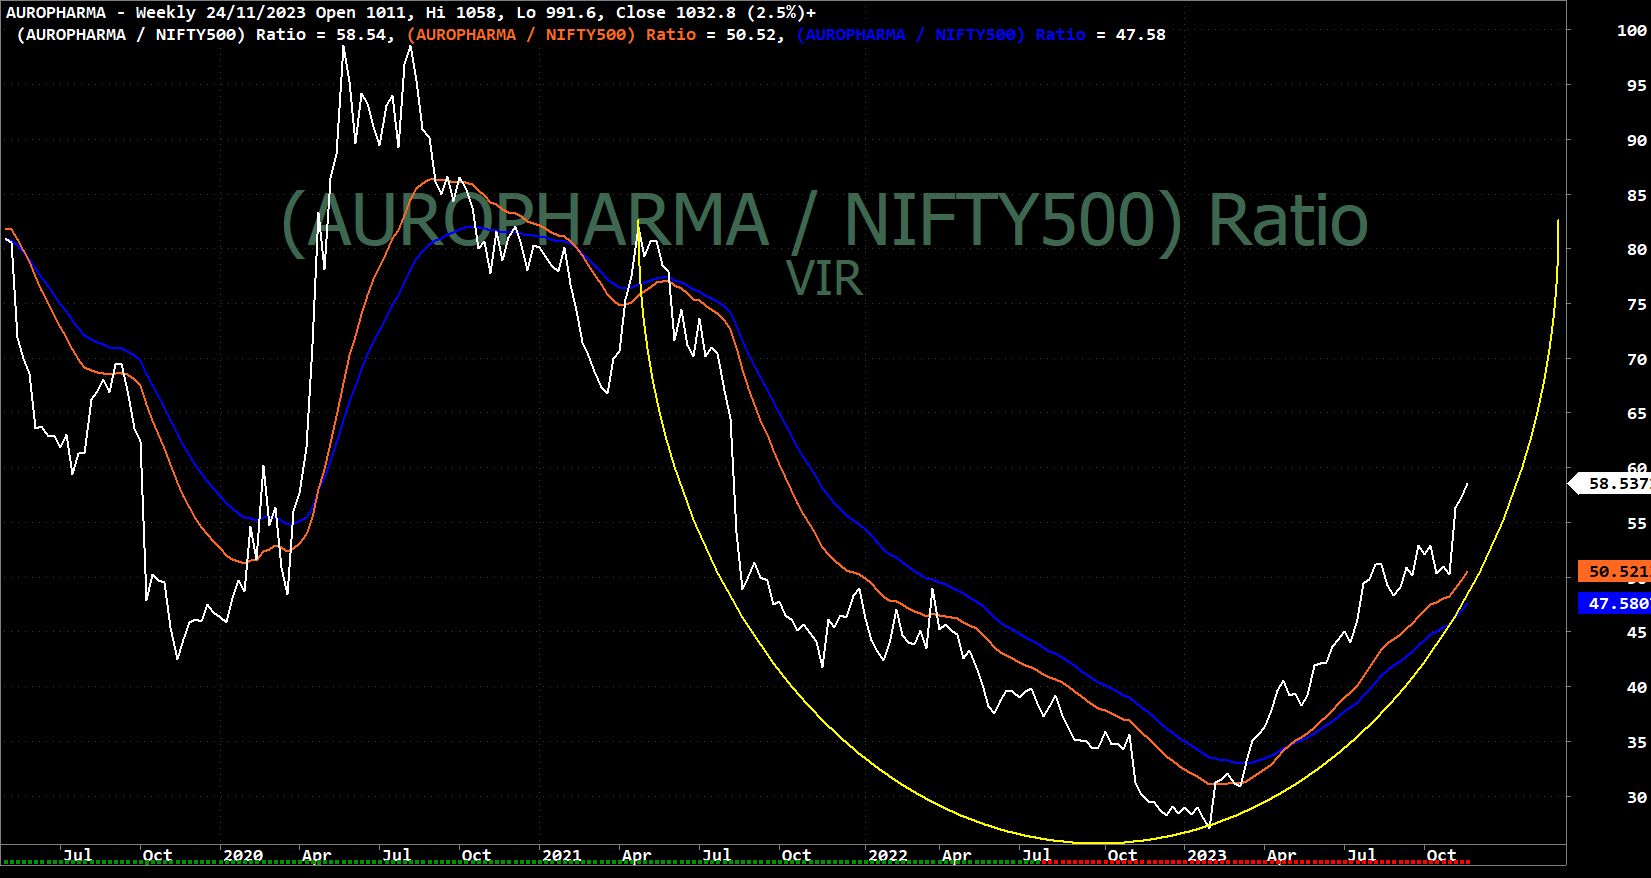
AUROPHARMA / NIFTY500

BHARATFORG / NIFTY500

BHARTIARTL / NIFTY500

BHEL / NIFTY500

BPCL / NIFTY500

COALINDIA / NIFTY500

DLF / NIFTY500

DMART / NIFTY500

FORTIS / NIFTY500

GICRE / NIFTY500

GODREJIND / NIFTY500

HDFCLIFE / NIFTY500

HEROMOTOCO / NIFTY500

HINDALCO / NIFTY500

HINDPETRO / NIFTY500
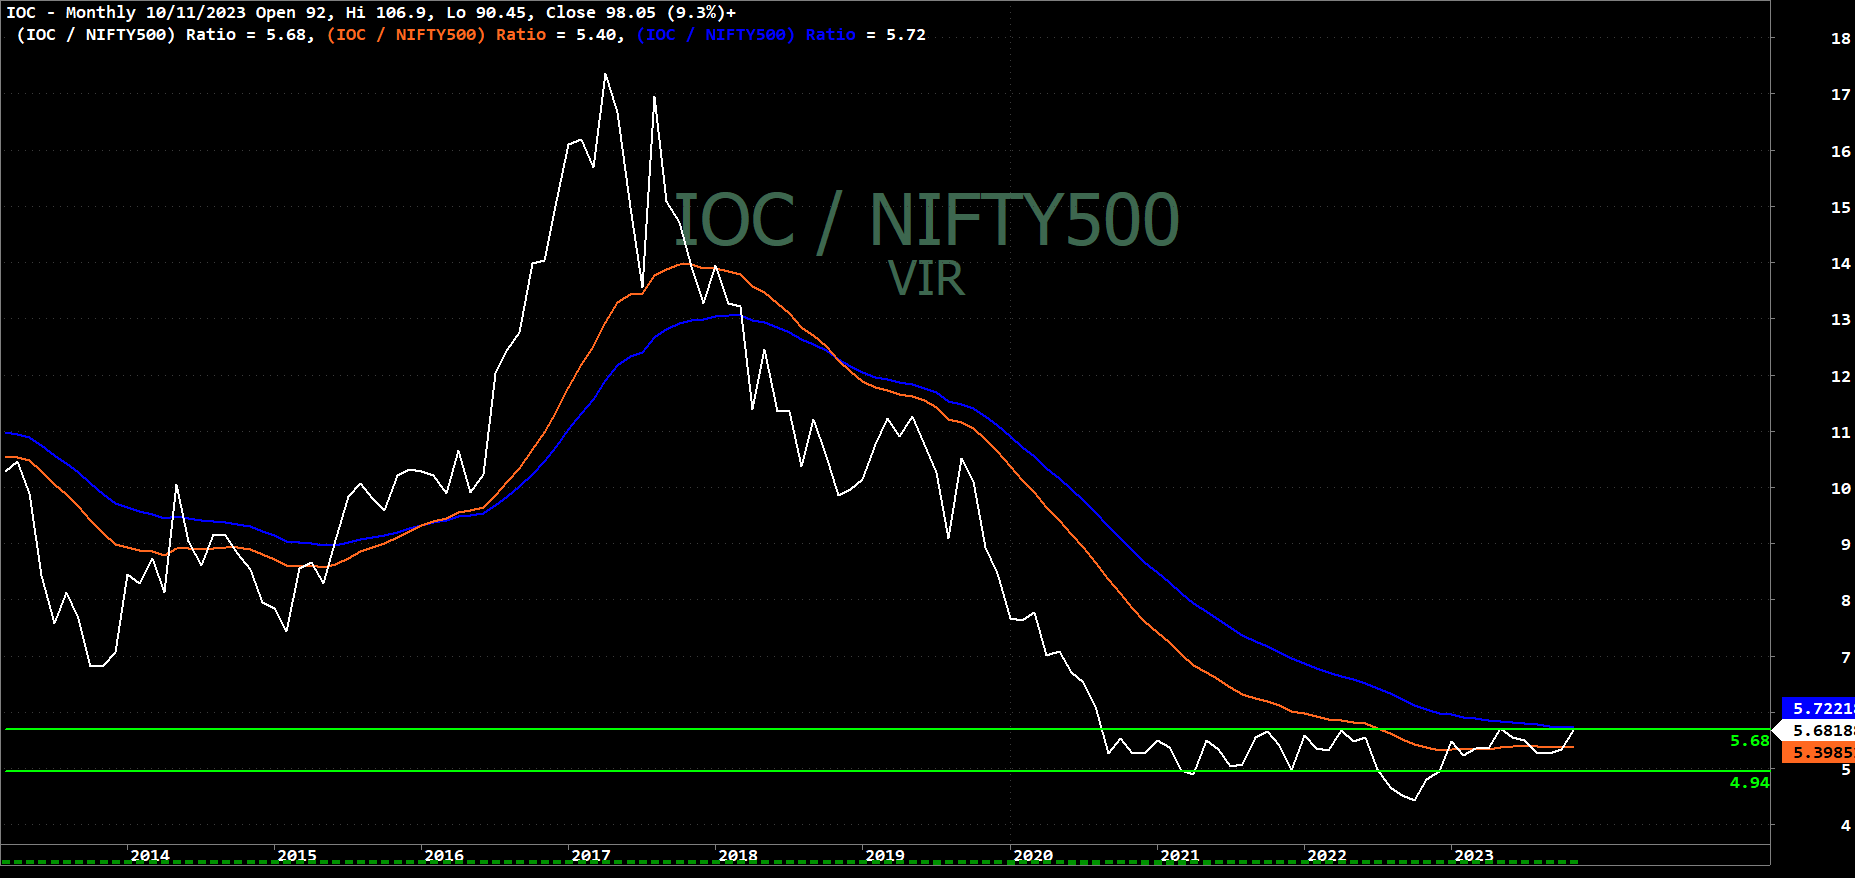
IOC / NIFTY500

IPCALAB / NIFTY500

KPRMILL / NIFTY500

L&TFIN / NIFTY500

LUPIN / NIFTY500

METROBRAND / NIFTY500

MFSL / NIFTY500

NHPC / NIFTY500

NIACL / NIFTY500

NTPC / NIFTY500

OBEROIRLTY / NIFTY500

TITAN / NIFTY500


 Thank you 

Happy & Profitable Trading cum Investments.
Have A Great Time.

TAKE CARE OF YOUR SELF

For More Details for Ratio Chart contact on Telegram
  
https://t.me/VD14455

Saturday, November 11, 2023

Diwali 2023 SIP Stocks VIew.

Shubh Diwali! May the festival of lights bring you good fortune and prosperity.


Here Are some Stocks For Next Year Goal Achievements.

Share My Personal View Only.

This is Pure Educational Purpose Only.

Simple One Rule for this Investments Follow for Risk and Money Managements.

Invest same amount every Month and same amount in Each Stocks.

1)  BPCL OR IOC

Here Attached Both Monthly Ratio Chart With NIFTY500 Index.


2) TATAPOWER
This Stocks also Monthly Ratio Chart For Your References.
Compare to Fall Rise Is Fast and then after small Retracement.
SO may Perform is May Continue in coming Months Also.


3) BANKBARODA OR CANBK OR PNB
All 3 PSU Banks are Looks Good On Monthly Ratio Chart With NIFTY500.
BankBaroda Sustain above Previous Swing Low.
CANBK Sustain above Previous Top and Try to Cross Previous Swing Low.
PNB Sustain above Previous swing High and Try to Find Support and bounce.


4) ITC
This Stocks is also Month Ratio Chart With NIFTY500 Index.
We see Break falling Trend line From 2013 and good Rise.
As Per Chart We see that RED Zone is 27 Months Fall and Green Zone is 17 Months Rise.
So Last Rise is More Faster then Last fall.
So Expecting This Out Perform May Continue In Coming Months.

5) GMRINFRA or LT
As per Monthly Ratio Chart of GMRINFRA We see that Break Out on Up side With Faster Up Move.
Red zone is 56 Months Fall and Green Zone is 50 Months Rise is More then fall.

As per Monthly Ratio Chart of LT, we see break falling Trend line from 2009 Top and 
Break 2014-15 to 2020 consolidation zone also.
We See same Rise May continue in coming Months also. 


As we Discuss investment RULE.
Example
Invest 25000 Per Month.
Then Each Your Selected Stocks 5000rs Each. 
So Number of Selected Stocks is 5.
Not Look for Quantity of Shares.
Just Think Risk and Return On INVESTMENT.

Happy Journey of Investments.