Saturday, October 2, 2021

IOC TECHNICAL CHART BASE RESERCH REPORT ON 02-10-2021.

 IOC CHART ANALYSIS  AS PER MY VIEW. 

THIS IS NOT ANY RECOMMENDATION OR BUY SELL SUGGESTIONS.

WE AM NOT SEBI REGISTERED ANALYST.

BEFORE TRADE CONSULTATION YOUR FINANCIAL ADVISOR OR AT YOUR OWN RISK.

==========================================

As per this chart we see Fibonacci Retracements from Recent swing top and  170.75 to 71.15 range 61.8% is near 132.70. (133)

As per this chart we see Fibonacci Retracements from Recent swing top and  231.45 to 71.15 range 38.2% is near 132.40. (133)


As per This 3rd chart we see down trend line from all time High is also crossed last month and close at top with Bullish Candle. and in this New Month also try to cross last month High.
We see Volume is also good in this rising time.


We see larger Picture of stock then we see 2008 Low and 2013 low Connect trend line also near at last 2020 Low. So This is 3rd time find support and then after start Higher High Formation on Monthly Chart. So we consider is a Strong support area.


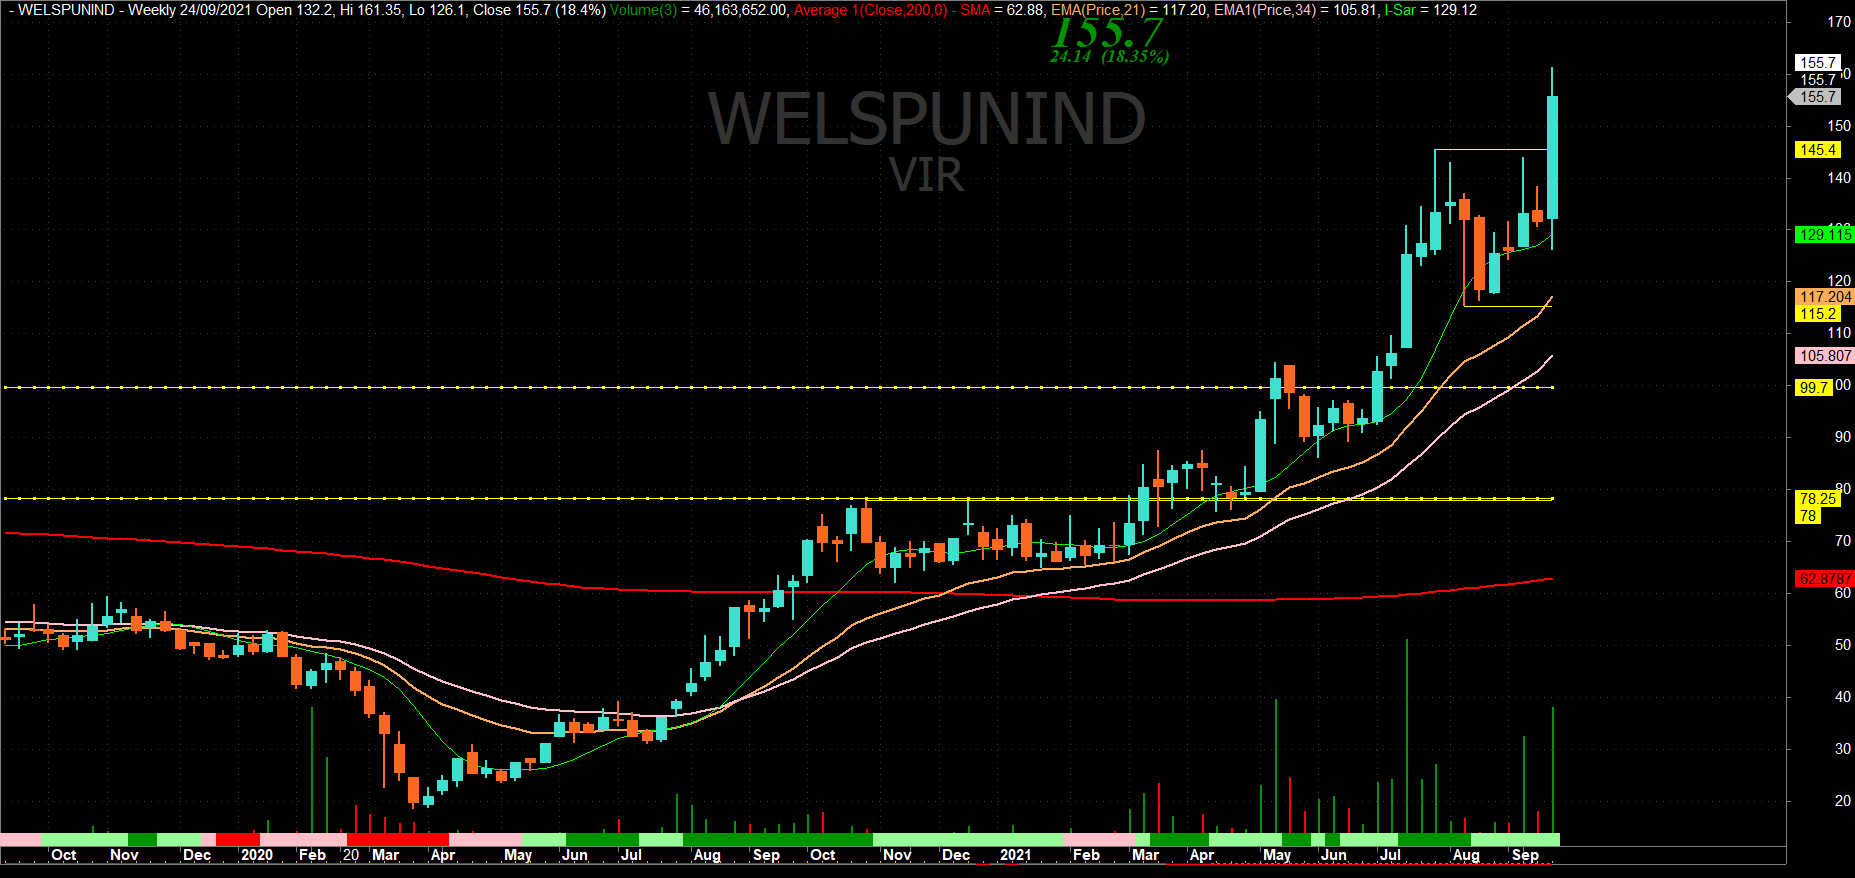
AS per this 5th chart is on Weekly Time frame.We See that Cross 2011 and 2015 swing top zone and 2018-2019 swing bottom zone and Close above that with good volume.


As per this 6th chart on Monthly time Frame is major simple Moving Averages.In this chart we see 20MA just find support of 200MA and turn upside. we consider this is positive indication also. 
20MA @ 94.78, 50MA @ 132, 100MA @ 121.60, 200MA @92.90. So out of 4 MA is currently Trade above 3 MA and 4th 50MA is also near at 132 (1st & 2nd chart Level is 133).


This Weekly Time Frame Ratio Chart of IOC / NIFTY50. 
In this chart we see that White Round area is consolidation period and then after cross falling trend line and after a long time close above 20EMA and 50EMA period moving averages. With that we show last swing High with White Dotted line. If cross that then we see 1st time cross swing high on ratio chart. we Feel that this is also a reversal sign for more upside.


As per this Last But Very Important chart. we see this Weekly chart one falling trend line. and only 4th number on falling trend line is cross previous swing top. But after 2020 Low is 3 time already done that price made Higher High on weekly basis.

So We expect above 133 Close on weekly basis or any other day with Good Volume then See Some Good and Sharp Up move in Coming days.


Saturday, September 25, 2021

Coal India My Technical view share here on Date 25-09-2021.

Coalindia 1st chart show that its break more then 2 yrs falling trend break in 2-3 Month before and then after its test that trend line again and start up side journey.

As per this 2nd chart we see short term Rising Wedge pattern on chart.Pattern up side Resistance Line is near 174 so in coming week it may be near 175. So is important number for more upside.


As per this 3rd chart we see some Fibonacci Retracements of previous swing level  of 271.45 to 109.55. Is 50% near 171.40.  So if Sustain above that is also important for next up move.

As per this chart we see its cross last 2 swing top which Higher Top Higher Bottom formation with good volume. 21w and 34w EMA slop also upside.

As per this last chart we wee some moving averages on price. After a More then 3yrs 1st time 20w MA (Yellow line) cross 100W MA (Gray Line). which show short term trend turn positive then higher term trend. which also indicate that up side move is strong if come.

So Summary is that this Coalindia Long strong up move in coming time. one can close watch it and take own decisions or contact your Financial Advisor also.


Have  Great time.

Weekly charts for 27-09-2021 and there after.

 Gujalkali 1st chart show that is trade in Rising Wedge this week cross upper line of wedge and close above that with good volume also.

2nd Chart show that last more then 2yr swing top also cross and close above that. Find 200w SMA support and bounce sharply, is indicate that strong up move in coming days or week.


======================================================================

Welspunind looks good as per below chart. after good consolidation its cross that level with good volume and close above that also on weekly charts So coming days we may see more up side move..

======================================================================


Fluorochem chart show that is in consolidation phase, if cross 1825-30 zone and sustain above that and volume high then we see good breakout in this stock. One can close eye on this stock for good possible up move.


Monday, August 9, 2021

Some Chart Study For 10-08-2021. 


Britannia 3 MA at almost  same level and 50MA cross 100MA and 200MA, 100MA cross 200MA. is look good positive indication.


Britannia break trend line and close above that.21 and 34d EMA also positive cross over there.


AS per this chart we see on RATIO chart also break trend line and support line.
One can buy above 3650 for target 3710 with stop of below 3625.
 

==================================================================

Eichermot we see upper trend line break and close above that but followup buying not seen and again close below trend line. if break yesterday low and sustain then se we see more downside. one can sell below 2716 for target 2645-2640-2615 with stop of above 2650.


=============================================================
KOTAKBANK near resistance trend line and near 200d SMA also there. 
If fail to cross the we see some downside.
=============================================================
 Grasim on price chart we see is close near trend line, But on Ratio chart we see its break trend line.
 we may see some more downside in coming days if price also break trend line.
  
======================================================
LT look 5 wave Complete.or near to complete. At top we see triangle pattern,if break support trend line then we see more downside.


Sunday, August 8, 2021

Some Weekly chart For The week 09-08-2021 


 Dabur :- As per chart we see is in rising channel and last week touch upper line of channel and down fast and close near low. if call "Bearish Engulfing" candlestick pattern. if next week trade and sustain below low 584  or Below 582 we see more downside.

Support Level :- 564-552-536-528-525-519.
Resistance Level :- 596-605-620.


====================================================

HDFC :- We see flag pattern breakout after 5month Consolidations with good volume. With that we see its break last swing High also. IF hold 2510 falling trend line level then we see more upside above 2685.

Support Level :- 2620-2590-2564-2560-2525-2510.
Resistance Level :- 2636-2685-2732-2763-2793-2896.

========================================================

 
Kotakbank :- AS per chart we see is in Expanding Triangle and last week its found support fall lower trend line and good bounce with good volume. after 4-5 month 1st time close above 20w SMA also. which we expect a strength after 4-5 month consolidation. if next week sustain above 1795 then we see more upside in coming days.

Support Level :- 1773-1755-1742-1740-1727-1720-1705.
Resistance level :- 1798(200D SMA)-1813-1828-1845.  


===========================================================

SBIN :- We see its cross 3month consolidation with good volume but close again below trend line with like "Shooing Star Doji" pattern and again close in previous 3-4 month range. If sustain below 430 then we see more down side. AS per 2nd Daily chart we see find resistance at 161.8% of last swing 442 to 400.5.

Support Level :- 430-427-435-429-427-419-417-408-400.
Resistance Level :- 441-448-445-462-468-484.

=============================================================
 
TCS :- we see on chart that its trade in rising wedge and find support of lower trend line of wedge and bounce with good volume and close near High. which indicate some strength in this stock. But as per 2nd chart we see its made high near previous swing top. 3340 to 3400 is good resistance zone. If cross and sustain that with good volume then we see new range of stock.

Support Level :-3265-3217-3164-3156-3132-3073.
Resistance Level :- 3354-3358-3400-3507-3533-3564-3667.


Sunday, July 18, 2021

આજના લેખમાં NIFTY, CENTURYTEX, HDFCLIFE અને SUNTECK વિષે વ્યૂ રજુ કરું છુ.


Nifty નો ચાર્ટ જોતાં ખ્યાલ આવે છે કે 15920-50 ખરેખર અગત્યના લેવલ નું જ કામ કરતું હોય એવું દેખાય છે. 15431 થી 14151 સ્વિંગ માં 138.2% નજીક છેલ્લાં 5 અઠવાડિયા થી High બનાવે છે પણ તેની ઉપર બંધ આપવામાં સફળ થતું નથી. જો 16000 ઉપર બંધ આવે તો જ ઉપરના વધુ લેવલ જોવા મળી શકે છે. ઉપરના લેવલ પાર nifty માં ખરીદી કરતાં વેચવાલી વધુ જોવા મળે છે. નવા High પછી પણ ચાર્ટ ઉપર તેજી નથી દેખાતી. India Vix પણ  નજીક હોય બજારમાં ઉપરનીચે બંને તરફ વધઘટ જોવા મળી શકે છે. તો જ્યાં સુધી ચોખ્ખી દિશા નથી માડતી ત્યાં સુધી વેપાર કરવા થી દૂર રહેવું વધુ સારું કહી શકાય.
NIFTY :- As per chart we see  15920-15950 is actualy work as resistance, 15431 to 14151 swing’s 138.2% is important level and last 5 week made high near that but fail to close above that. So above 16000 close we see more upside. On upper side of level we see some selling. India VIX also near 12 which indicate volatility in market. So avoid trade in nifty till that no clear direction.
Support Level :- 15850-15730-15650-15565-15470/30.
Resistance Level :- 15950/70-16020-16100-16180-16250.  
 
 ============================================
 
 
Sunteck નો ચાર્ટ જોતાં ખ્યાલ આવે છે કે 30 મહિના થી એક Triangle pattern માં ટ્રેડ થઈ રહ્યા હોય એવું દેખાય છે. આ અઠવાડિયે ઉપર તરફ ની ટ્રેન્ડ લાઇન ઉપર બંધ આપવામાં સફળ રહ્યું છે તે પણ સારા વોલ્યૂમ સાથે. સાથે 200W sma ઉપર પણ બંધ આપવામાં સફળ રહ્યું છે. એ જોતાં આવનાર દિવસોમાં વધુ ઉપરના લેવલ જોવા મળીશકે છે.
Sunteck :- As per chart we see 30 month triangle pattern. This week success to cross and close above that with good volume. With that we see cross and close above 200w sma also. So expect good upside in coming days.

Support Level :- 365-356-353-330-324-319.
Resistance Level :- 380-394-408-421-457-487.
 
 =====================================


HDFCLIFE નો ચાર્ટ જોતાં ખ્યાલ આવે છે કે તે એક ચેનલ માં ટ્રેડ થાય રહ્યા છે. પાછળ ના છેલ્લા 2  અઠવડિયા માં સારા વોલ્યૂમ સાથે ભાવ નીચે આવ્યા હતા પણ ચેનલ ની સપોર્ટ લાઇન જાળવી રાખવામાં સફળ રહ્યું છે અને પાછું આ અઠવાડિયા સારા વૉલઉએમ સાથે ઉપર તરફ ની કોશિશ કરતું દેખાયું છે. 703 ઉપર વધુ ઉપરના લેવલ જોવા મળી શકે છે.
HDFCLIFE :- As per chart we see its trade in channel and previous 2 week price fall with good volume but success to hold support trend line. And this week we see some reversal upside in this stock. So above 703 we see more upside.

Support Level :- 688-684-680-672-666-657.
Resistance Level :- 710-720-731-746. 
 
 =======================================
 
Centurytex  નો ચાર્ટ જોતાં ખ્યાલ આવે છે કે તે એક ઉપર તરફ ની ચેનલ માં ટ્રેડ થાય રહ્યા છે અને પાછલા અઠવાડિયે ઉપર તરફ ની ટ્રેન્ડ લાઇન ઉઓર બધ આપવામાં સફળ રહ્યું છે. સાથે ઉપર 200W sma પણ 740 નજીક જ આવે છે, જો 700 ઉપર રહે ત્યાં સુધી ઉપર માં 740 સુધીના લેવલ જોવા મળી શકે છે, 740 ઉપર બંધ આવે તો વધુ ઉપરના લેવલ શક્ય બની શકે છે.
Centurytex :- As per chart we see it’s trade in rising wedge and last week close above resistance line. Above that we see 200W sma near 740. Till 700 hold we see more upside till 740. close above 740 more upside level possible.
Support Level :- 700-694-679-654-622.
Resistance Level  :- 735-740-750-771-824-876.