NIFTY
As per this 1st chart we see that Nifty Not enter in falling wedge and find support near resistance line of wedge, and made a bullish candle with very good volume.

As per this 2nd chart we see that Horizontal Line support resistance levels. We see that 18095-18114 is good resistance zone.

As per this 3rd Daily chart we see that Nifty is in falling channel and last week made low near support line of channel and then bounce.We see that Nifty Trade below Major Moving averages 20-50-100D SMA and 20-100 D SMA negative cross over. so 17900-940 is work as resistance zone.

As per this 4th Daily chart we see some Elliott Wave Calculation. As per My view if Hold This 17353 Low and Cross 18020-18050 zone and close then chance that is 3 wave is may be ABC correction count. Near 17850 is last week big candle 50% level and Nifty close
just above that at 17854. So if this week sustain above that then 78.6% of last swing is near 18020. So Upper side some resistance zone we see. so upside journey is not easy for Nifty in coming Days.

As per this 5th chart we see that Nifty Find Support Near 200D HLC EMA zone and made Low near that zone. We see in OCT-2022 work as support zone and we see New High and June -2022 work as Resistance zone and we see New sing Low 15181 also. So till Hold this zone we are see more upside.

So upside so many Resistance zone and on down side near current swing Low is good Support Level.
So we may see some range bound Move in coming days.
==========================================
Ashokley
As per chart if cross last week High and sustain above that then we see some good up move. and On Weekly Ratio chart we see if cross falling trend line then we see New High In coming Weeks.


CCL
If Made new High and sustain then we see good break out on Upside.


=========================================
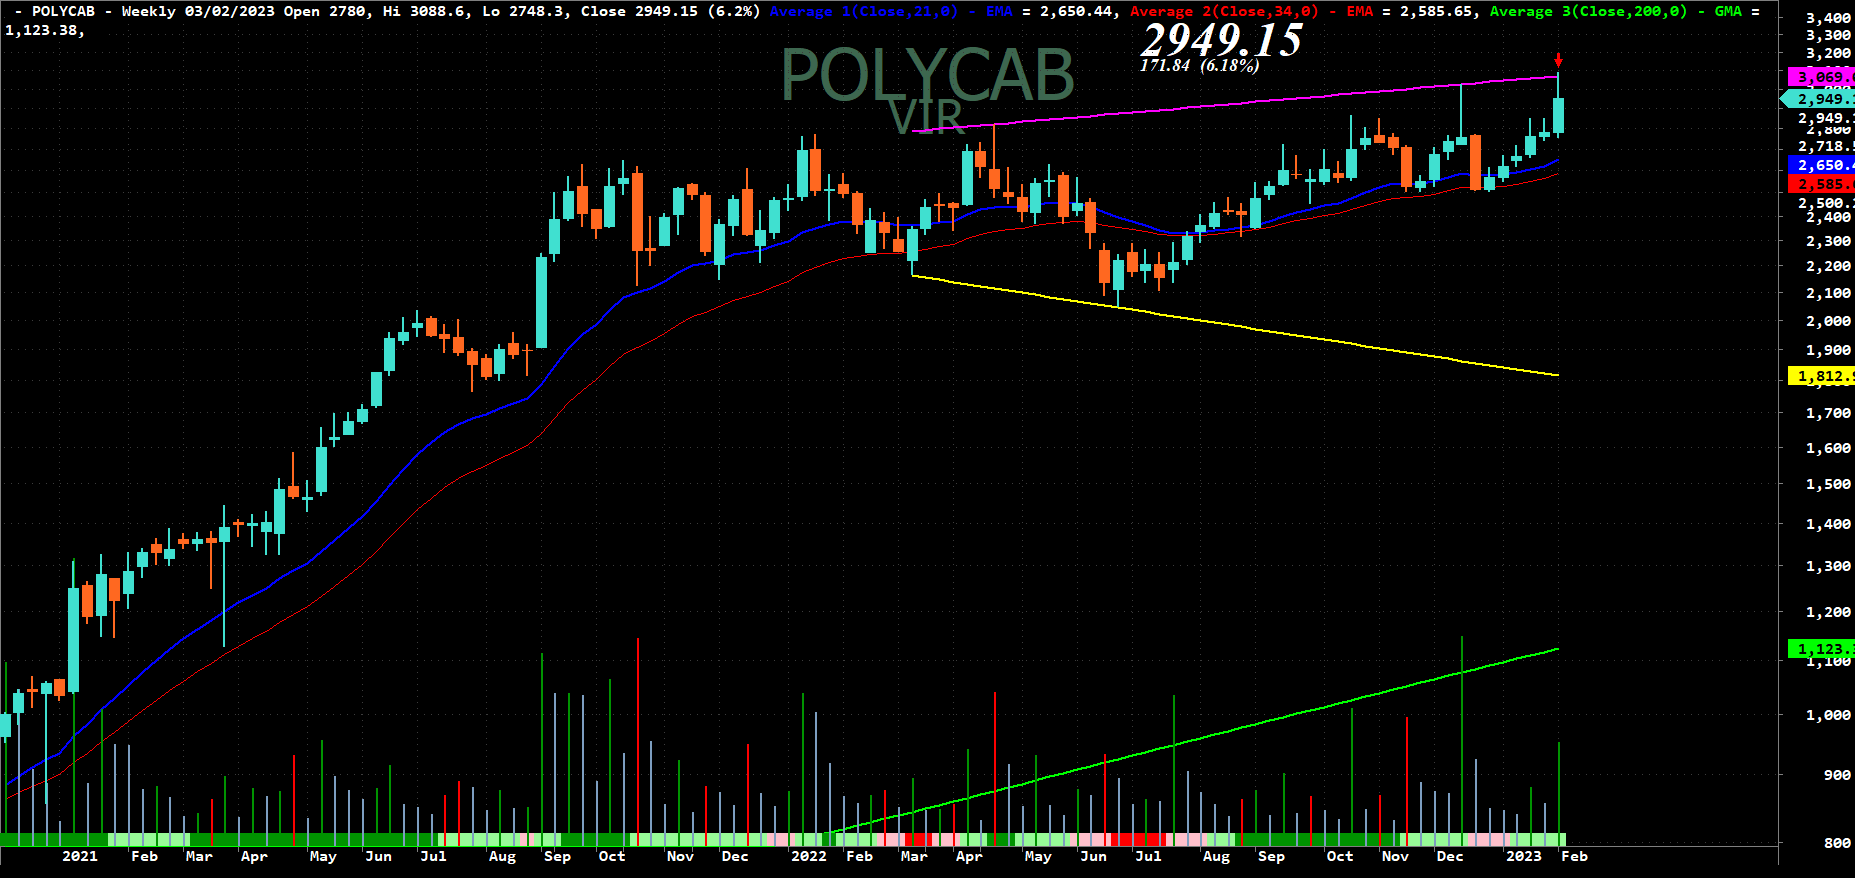
POLYCAB

==========================================
RADICO
If Sustain above 1140 Then we see more upside in coming Days.


==========================================
TCS
If Sustain above 3500 then we see some Good Up move in coming Days.


==========================================
*SEBI SOCIAL MEDIA MANDATE & MANDATORY DISCLAIMER AS REQUIRED BY SEBI*
*KIND ATTENTION OF ALL MEMBERS*
Disclaimer from Admins as per SEBI norms:
Equity
Investments are subject to 100% market risks. Kindly refer to your
financial consultant advice before Trading & Investing in stock
markets.
This
group/channel is only for Educational and Learning, Knowledge Purposes.
Admins have no responsibility for your intended decision &
financial losses. Keep calculated & always analyzed your cash
position and risk bearing capacity before following msg of our group
postings.
Stock
market investments are VERY RISKY and being part of this group, you
agree that you understand the Market risks involved. Profits and Losses
are part of Share market. Most of the times, retail traders end up
making only Losses in Share market.
Kindly understand and act wisely. All member pls follow guidelines as applicable even in past too.
*SEBI SOCIAL MEDIA MANDATE & MANDATORY DISCLAIMER AS REQUIRED BY SEBI*
*KIND ATTENTION OF ALL MEMBERS*
*Disclaimer/ disclosure*
👉This group/channel does not provide any tips/recommendations/advice
👉All updates/analysis/posts/discussions are only for educational and learning purpose.
👉Do Consult your financial advisor before taking trades or investment decisions
👉Group/Channel Admins or Members are not responsible for any financial losses
👉Disclaimer/disclosure/terms and conditions applicable to all members of this group/channel
We are not SEBI registered. Members posting may not be SEBI registered also.
All the posts are for education and learning purpose only.
No comments:
Post a Comment