From 11-11-2022 Database For Educational Purpose Only. Trade at your own Knowledge and Risk.
We are not liable of any Loss.
we are not SEBI register advisor.
NIFTY Daily chart show Expanding triangle Break Out on Upside with "Hanging Man" candlestick formation. As per 2nd chart we see that trade near all time High, and close just near 2nd Highest top. As per 3rd chart we see that on weekly chart Triangle Break Out. So if Nifty nexy week sustain above this week High 18362 then we may see New All Time High in coming days or Weeks. .
=================================================
Manappuram chart show that after long time first time made Higher bottom and may cross 112 then Higher Top Formation active. On 2nd Ratio Chart we see that almost last 6-7 month down trend line break last week. on Price chart trade above 112 then we see some good Bounce in coming days.
Support Level :- 108-102/103 zone.
Resistance Level :- 117-128-136-141-157.
=======================================================
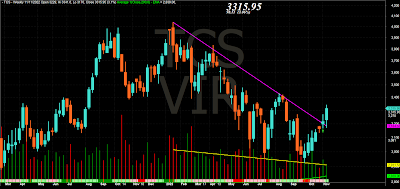
TCS On 1st chart weekly Triangle pattern more then 2yrs and this week again close above that trend line. on 2nd Weekly chart we see that From Jan-2022 top Falling Trend line break and success to close above that. on 3rd chart we see some vertical support Resistance levels. and 21-34 EMA, after May-2022 1st time close above both WEMA 21&34.Last 7 candle continue Higher Higher High Higher Low formation. and if cross 3425-30 zone then Higher High after Jan-2022 Top. on 4th chart we see that after Jan-2022 top 1st time 2 green candle above Middle line of BB. and on last pane we see that RSI also break Trend Line on Weekly Chart. so coming days if cross 3352 (38.2% of last swing as per 5th chart) then we see some good upside,
Support Levels :- 3160-70 zone.
Resistance Levels :- 3390-3430-3450-3484-3616. (Above 3616 { 61.8% } may new up trend start)
=======================================================
GICRE 1st Weekly chart SHow that after 8-9 month Try to break range with very good volume. and if Sustain above 150 then 1st time cross range and Higher Swing High. On 2nd weekly chart show that after March-2021 top break falling Trend line with good volume. On 3rd weekly Ratio Chart we see that almost 7-8 month consolidation On ratio chart break that range and close above that. So coming days if sustain above 150 then we may see some good upside move in coming days or weeks.
Support Levels:- 142-135-131-129.
Resistance Levels :- 154-158-162-170-176++.


Excellent sir.
ReplyDeleteThanks dear.
DeleteAwesome sir
DeleteThanks
DeleteNice
ReplyDeleteThanks dear
ReplyDelete