Saturday, August 28, 2021
Monday, August 9, 2021
Some Chart Study For 10-08-2021.
Britannia 3 MA at almost same level and 50MA cross 100MA and 200MA, 100MA cross 200MA. is look good positive indication.
Britannia break trend line and close above that.21 and 34d EMA also positive cross over there.
==================================================================
Eichermot we see upper trend line break and close above that but followup buying not seen and again close below trend line. if break yesterday low and sustain then se we see more downside. one can sell below 2716 for target 2645-2640-2615 with stop of above 2650.
Sunday, August 8, 2021
Some Weekly chart For The week 09-08-2021
Dabur :- As per chart we see is in rising channel and last week touch upper line of channel and down fast and close near low. if call "Bearish Engulfing" candlestick pattern. if next week trade and sustain below low 584 or Below 582 we see more downside.
Support Level :- 564-552-536-528-525-519.
Resistance Level :- 596-605-620.
====================================================
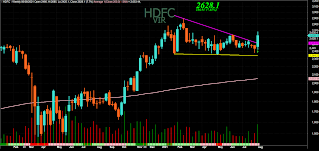
HDFC :- We see flag pattern breakout after 5month Consolidations with good volume. With that we see its break last swing High also. IF hold 2510 falling trend line level then we see more upside above 2685.
========================================================
Support Level :- 1773-1755-1742-1740-1727-1720-1705.
Resistance level :- 1798(200D SMA)-1813-1828-1845.
SBIN :- We see its cross 3month consolidation with good volume but close again below trend line with like "Shooing Star Doji" pattern and again close in previous 3-4 month range. If sustain below 430 then we see more down side. AS per 2nd Daily chart we see find resistance at 161.8% of last swing 442 to 400.5.
Support Level :- 430-427-435-429-427-419-417-408-400.
Resistance Level :- 441-448-445-462-468-484.
Support Level :-3265-3217-3164-3156-3132-3073.
Resistance Level :- 3354-3358-3400-3507-3533-3564-3667.


